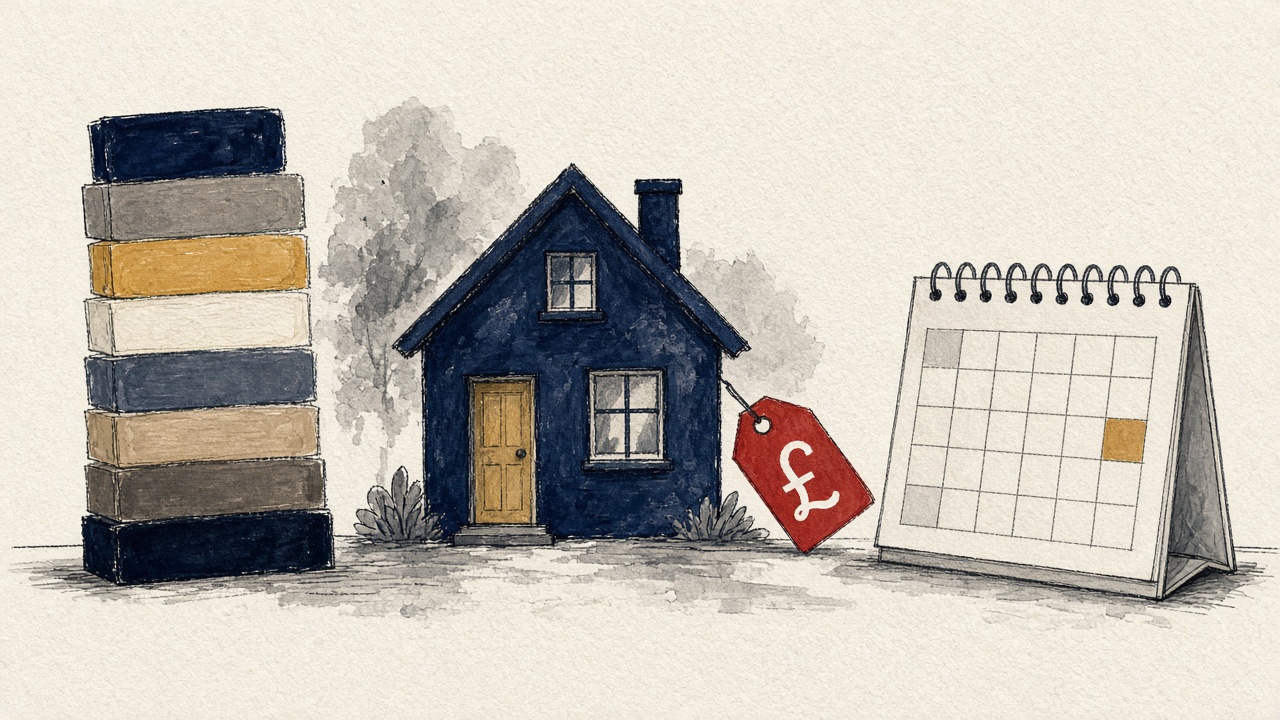
In September 2004, Welsh local government minister Sue Essex told the BBC she expected half of Wales's homes to stay in the same council tax band after revaluation, with equal shares moving up or down. The letters that followed told a rougher story: across Wales, one home in three would pay more because it had landed in a higher band, while only 8% would move down. In Cardiff alone, 67,775 dwellings shifted up a single band. England watched, postponed its own scheduled update, and then deleted the legal deadline that would have forced the next one.
The letter that jumped a third of Wales
Council tax banding is not a council spreadsheet exercise. The Valuation Office Agency, part of HMRC, assigns each dwelling a letter from A to H in England; billing authorities turn that letter into a cash bill by setting a Band D rate and applying statutory ratios. The VOA does not set how many pounds you pay. It sets where you sit in the pecking order.
Wales chose a different valuation day when it rebuilt its lists. Bands there reflect 1 April 2003 prices, and the new list took effect for 2005 bills. When the Welsh Government published the movement counts, the political lesson was immediate: 438,760 properties moved up at least one band, while the forecast Essex had offered the previous year assumed symmetry that never arrived.
The revaluation was not a dry statistical exercise for Cardiff. Assembly tables lodged with the Lyons Inquiry show 67,775 homes in the city moving up exactly one band, a concentrated jolt in the capital where prices had run ahead of the old list. Relief schemes capped how fast bills could rise in cash terms, but they could not erase the political memory of envelopes arriving on doormats.
Homeowner Mary Simons told BBC Wales she was already worried about the post. "I am getting a bit concerned about it. We'll have to cut back a heck of a lot," she said. Ministers promised transitional relief so no household would leap more than one band in a single year at first, but the underlying distribution had moved. Welsh Assembly figures later attributed about 6% of the growth in council tax income to homes sliding up the band ladder after revaluation.
Eight buckets priced in 1991 money
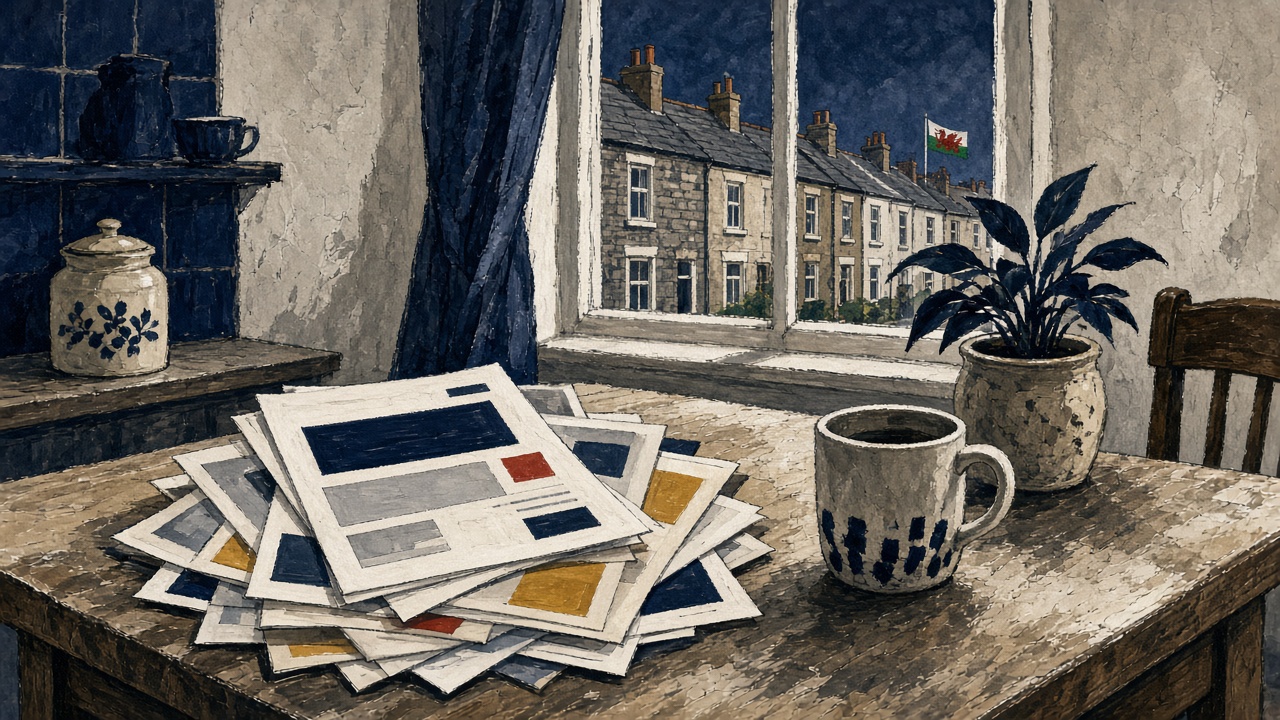
England never took that Welsh path. On the list that still governs bills in 2026, every band is defined by what a home would have sold for on 1 April 1991. Band A covers values up to £40,000 on that scale; Band D runs from £68,001 to £88,000; Band H starts at £320,001. New flats and conversions entering the list today are not priced at today's market. They are priced at a counterfactual 1991 value inferred by valuers.
The result is a tax that moves with local politics every April but barely moves with three decades of house price inflation at the national level. HM Land Registry's UK House Price Index puts the average sale price at £52,372 in April 1991 and £256,478 in April 2024. The top band threshold is still expressed in 1991 pounds.
Fresh Valuation Office statistics published in September 2026 show how those frozen thresholds shape the stock. England had 6.1 million Band A homes, 23.6% of all banded properties, while Band H contained only 0.6% of the stock. London, the East and the South East now cluster most often in Band C, between 26% and 27% of homes in each region. In the North East, by contrast, Band A still holds between 30% and 52% of properties depending on the local authority. The north-south tilt in band letters is real, but it is a tilt measured against 1991 coordinates.
From poll tax wreckage to a frozen list
Council tax arrived in 1993 as the political repair after the poll tax collapse. Parliament needed a domestic property tax that felt less intrusive than per-head charges yet could be deployed quickly. The Local Government Finance Act 1992 instructed valuers to treat 1 April 1991 as the "appropriate date" for the first English and Welsh lists. Regulations setting those band edges were tweaked once, in 1994, and not rewritten since, according to HMRC's statistical background notes.

From the start, the tax was a relative ranking device. Councils compete on Band D cash rates, but the VOA's letter sets the statutory fraction of that headline charge your household owes. That design made a revaluation politically explosive: it would not change total council spending, but it would shuffle who paid what share.
Ministers understood the risk early. A 2001 white paper, quoted in the 2006 Act's explanatory notes, promised that England would complete a first revaluation in time for 2007 bills and repeat the exercise at least every ten years. The Valuation Office would have had to reprice millions of dwellings against a new anchor date. Instead, the anchor stayed 1 April 1991, and the band edges written in 1994 still define who is "cheap" and who is "expensive" on the list.
When Wales updated, Westminster flinched
Whitehall initially promised to keep values current. Explanatory notes for the Council Tax (New Valuation Lists for England) Act 2006 recall a 2001 commitment to complete a first English revaluation for bills issued in 2007, with further updates at least every ten years. Wales's experience hardened nerves. By September 2005, with Sir Michael Lyons still reviewing local government finance, ministers postponed England's revaluation to avoid pre-empting his report.
The hard numbers from Wales's exercise remained on the record: 773,305 properties stayed in the same band, but far more homes moved up than moved down compared with early expectations. For England's Treasury watchers, that was not an abstract fairness debate. It was 438,760 households discovering a step up on the multiplier ladder.
The 2006 law that made delay permanent
Postponement became structure in 2006. The Act removed the statutory requirement to revalue on 1 April 2007 and on every tenth anniversary thereafter. Instead, the Secretary of State may name a year by order, subject to the Commons affirmative procedure. No order has reset England's list on a new price day since the original 1991 anchor.

When the coalition government arrived in 2010, it turned delay into a manifesto line. The BBC reported a pledge that there would be no revaluation of English bands during that Parliament, cancelling Labour's abandoned 2007 plan. The same report noted that Labour had once intended to revalue millions of homes before the Welsh backlash and the Lyons review intervened. Communities Secretary Eric Pickles framed the choice as protecting homeowners from bill shocks. He also offered a defence that survives in policy arguments today.
They are roughly in the same position they were 20 years ago so there's no need for a revaluation.
The claim is about relative shares, not levels. Band counts can look stable even when the pounds inside each band diverge wildly from market reality.
Why extensions and new streets stay stuck
Even without a national revaluation, individual bands do move, but the law narrows the gate. Section 24 of the 1992 Act, as implemented in regulations, blocks routine band changes unless specific triggers fire. A material increase from building work counts only when followed by a qualifying sale or long lease. A material reduction can follow demolition or a sharp change in the neighbourhood, but the everyday case of a loft conversion is deliberately parked.
HMRC's statistical guidance spells out the operational consequence. If a property has been improved since it was first banded, the Valuation Office cannot reband to reflect the extra floor space until a sale occurs. Those homes carry an Improvement Indicator in the database, meaning the bedroom count on file may lag the bricks-and-mortar reality. Owners can challenge bands they think are wrong, but the statutory tests favour stability over annual mark-to-market.

Meanwhile the list itself keeps growing. Between 31 March 2025 and 31 March 2026, England and Wales added 198,820 newly banded properties, a 0.7% rise to 27.4 million dwellings on the register. Each new entry is priced through the 1991 lens. The Valuation Office's September 2026 release is a census of those letters, not of what homes would fetch on Rightmove this afternoon.
The north–south argument—and its limit
Pickles's reassurance points to a genuine feature of the system: council tax is highly regional in practice because Band D rates and band mixes differ by authority. The 2026 VOA tables show Band A still dominant across much of northern England, while southern stock piles into Band C. If your policy goal is to preserve those regional ratios, a revaluation looks optional.
If your goal is to align tax shares with housing wealth as it exists now, the same data look like a compass frozen in 1991. Average transaction prices quintupled between April 1991 and April 2024, yet the statutory band ceiling remains £320,001 on the old scale, and only 0.6% of English homes sit in Band H. In London, where flats and maisonettes dominate the stock in the 2026 tables, most households still sit in mid-rank bands because the list measures relative 1991 value, not today's penthouse prices.
Wales proved that updating the scale moves real money: a third of homes stepped up when lists caught up to 2003 values, and band movers alone fed roughly 6% of the growth in council tax income in the year after revaluation. England's response was not to refine the model but to remove the calendar that required the next try. The September 2026 VOA release counts 27.4 million banded homes, each one sorted into a letter that still whispers a price from the year the poll tax died.
On a new street in 2026, the first council tax bill will still rest on a valuer's estimate of what that kitchen and roof would have been worth on 1 April 1991. The date is not a footnote in the legislation. It is the property tax.