Researchers at Stanford University’s Environmental Change and Human Outcomes lab on Monday published a California-specific extension of their daily wildfire smoke PM2.5 dataset, aggregating 10-kilometer grid estimates to school district boundaries through December 2023. The release pairs geospatial smoke layers with federal school location files so district officials can compare exposure on instructional days against weekend and holiday baselines.
What the dataset measures
The underlying model—documented in prior Environmental Science & Technology work and a beta v2.0 grid covering 2006–2023—attributes fine particulate matter to smoke plumes rather than all PM2.5 sources. For each district and calendar day, the new tables provide smoke-attributable concentrations in micrograms per cubic meter, plus flags for whether smoke exceeded common health thresholds used by state agencies during wildfire emergencies.
Aggregation uses population-weighted averages across census blocks that intersect district polygons, following methods the lab applied nationally in earlier county and tract releases on Harvard Dataverse. California’s fragmented district map—more than 1,000 local education agencies—required custom crosswalks to National Center for Education Statistics identifiers so public-health officers can join smoke exposure to enrollment counts without manual GIS work.
How schools might use it
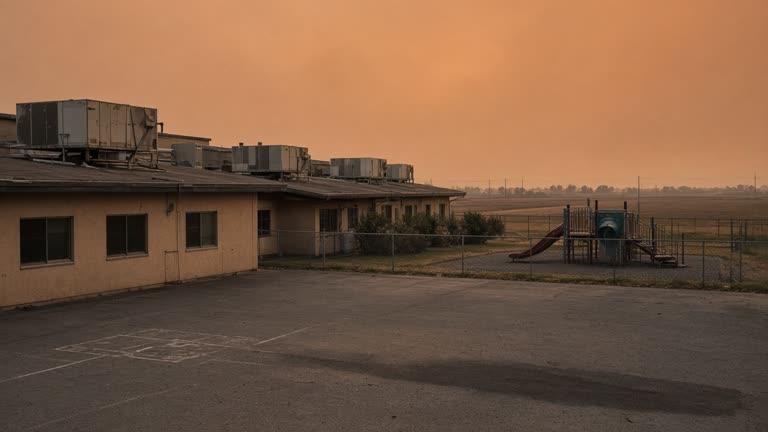
Districts from Los Angeles Unified to rural Sierra foothill systems have faced repeated “smoke days” in recent fire seasons, often deciding closures with uneven local monitor coverage. A common Stanford-backed series does not dictate policy, but it gives superintendents the same daily number when they debate outdoor athletics, filter upgrades, or bus routes through basins where smoke pools overnight.
The release cites prior Stanford work linking multi-week smoke exposure during the academic year to small but measurable dips in standardized test performance across U.S. districts between 2009 and 2016. Authors of that study were careful not to claim causality for individual students; the new California tables are descriptive exposure data, not predictions of learning loss.
Limits researchers emphasize
Smoke PM2.5 estimates rely on satellite plume annotations, meteorology, and statistical fusion with ground monitors where available. They can miss short-lived spikes between overpasses or misallocate plumes in complex terrain. The lab labels the California district files as version 1.0 and plans 2024 updates after final quality control on grid inputs.
Indoor concentrations can diverge sharply from outdoor smoke PM2.5 depending on building age and filtration; the dataset does not model classroom air unless districts supply their own ventilation data. Public download mirrors are hosted on Stanford DataWorks with documentation on uncertainty intervals by district size.
What comes next
State education officials said they will review whether to incorporate the series into voluntary guidance for athletic cancellations, complementing California Air Resources Board messaging on outdoor activity. Academic teams are invited to reproduce aggregates using open R scripts the lab posted alongside the national GitHub repository.
For scientists, the contribution is standardization: one daily smoke-attributable PM2.5 number per district, aligned to the same school-year calendar researchers use in education studies. For administrators bracing for another fall fire season, that is a modest but concrete input—provided they treat it as exposure accounting, not a substitute for classroom air measurements or clinical advice.