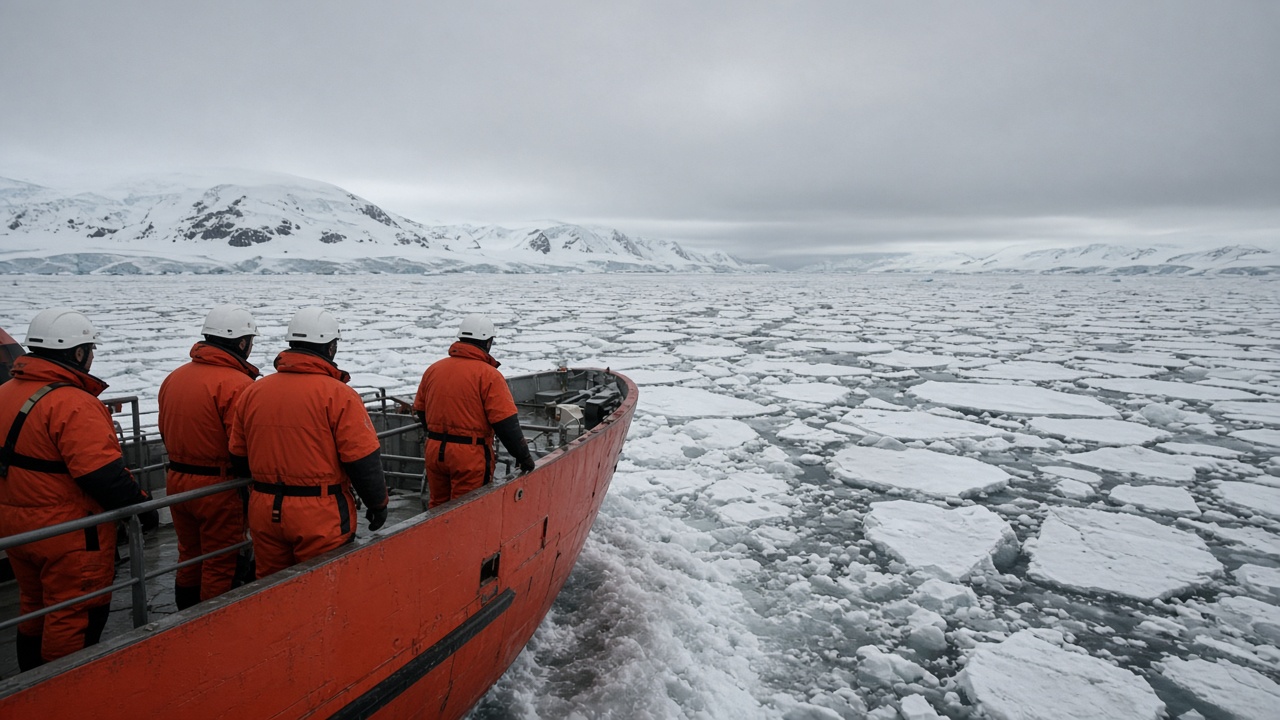
Imperial College London scientists published a high-resolution map of Antarctic ice-shelf thinning on Wednesday, blending NASA ICESat-2 laser altimetry with ground GPS stations maintained by British Antarctic Survey teams.
The study, appearing in Nature Geoscience, focuses on ice fronts bordering the Bellingshausen Sea, west of the Antarctic Peninsula. It finds average thinning of 1.4 metres per year since 2019 along several pinning points that had been stable through the 2010s, raising the odds of faster glacier flow into the Amundsen Sea embayment.
Method
Lead author Dr Priya Nandhakumar said the team corrected satellite tracks for cloud cover gaps by interpolating between BAS winter flights that measured surface elevation with airborne lidar. The merged product resolves features as small as 500 metres, sharp enough to link melt ponds on the shelf to fractures propagating toward the grounding line.
Unlike earlier gravimetry studies that smooth signals over hundreds of kilometres, the laser survey catches short pulses of warm ocean water routed through submarine canyons. Those pulses correlate with marine heatwaves detected by Met Office ocean models assimilating Argo float data.
UK policy relevance
Ministers citing Antarctica as a distant problem may need to update talking points. Thinner ice shelves reduce braking on land ice that, if lost, would lift global sea levels measurably. The UK Climate Change Committee’s coastal adaptation plan already assumes higher Thames Barrier closures; faster Antarctic melt would pull forward those scenarios.
British research ships RRS Sir David Attenborough and upcoming drone campaigns will test whether the laser map predicts where crevasse fields are widening ahead of the 2027 field season. NERC has committed £14 million for autonomous underwater gliders to monitor warm water intrusions.
Limits and next steps
Sceptics note the record spans barely six years, a blink in glaciological time. The authors acknowledge uncertainty in bedrock topography beneath floating ice, which controls where fractures stall. They plan to ingest European Space Agency CryoSat radar to extend the timeline backward.
For classrooms, the team released interactive layers on the NERC data portal, letting students compare Peninsula melt with Greenland blocks measured by the same satellite. Public engagement staff hope the visuals counter fatigue around polar headlines by showing street-level consequences for Norfolk and Somerset flood schemes.
Why it matters this week
The paper drops as COP negotiators prepare positions for the next UN climate summit and as Storm systems batter UK coasts. Science cannot attribute a single weather event to Antarctic melt, but every refined estimate tightens the range for planners approving seawalls and rail drainage upgrades. Imperial’s map is one more weight on the scale pushing adaptation budgets upward.